

FINANCIAL PROFESSIONALS ONLY
Global Small-Cap Market Overview
September 30, 2024


Table of Contents
43Q24 Global Small-Cap Overview
5Year-to-Date Global Small-Cap Overview
63Q24 Global Sector and Industry Review
7Year-to-Date Sector and Industry Review
83Q24 Region and Country Review
9Year-to-Date Region and Country Review
11Global Small-Caps: More Consistent Than You Think
12Global Small-Cap Has Consistently Beaten Global Large-Cap
13Global Small-Cap’s Most Recent Recovery is an Anomaly vs. the Historical Pattern
14100% of the Time, Positive 3-Year Returns Have Followed Low-Return Markets
15Global Small-Cap Outperformance Under Different Regimes
16Global Small-Cap P/Es are Slightly Above Their Historical Average
17Global Small-Cap Market Outlook
18Despite Leading in 3Q24, Global Small-Cap Is Trailing Large-Cap YTD
Market Overview
Global small-caps advanced in the third quarter of 2024 as the expectation of easier monetary policy became a reality. Yet even with a strong quarterly showing, stocks and bonds from many geographies wrestled with a challenging combination of stubborn inflation, rising interest rates, and stalled economic growth that has led to earnings declines. And while recession remains a reality or possibility (depending on geography), none of us knows how long it will last or how deep it will go. What we do know is that any recession—like any bear market—is ultimately finite. Any recession will be followed by a recovery. It’s worth keeping in mind that history also shows that small-caps will likely begin an upward move before many of us know for sure that the economy is rebounding in earnest. Amid the difficulties of bear markets and periods of economic uncertainty, we think it’s crucial to remind investors of the opportunity to build their small-cap allocation at attractively low prices. History shows the rewards that have accrued to investors who had the necessary patience and discipline to stay invested during periods of sluggish or negative performance. We continue to see the currently unsettled period as an opportune time to invest in select small-caps for the long run.

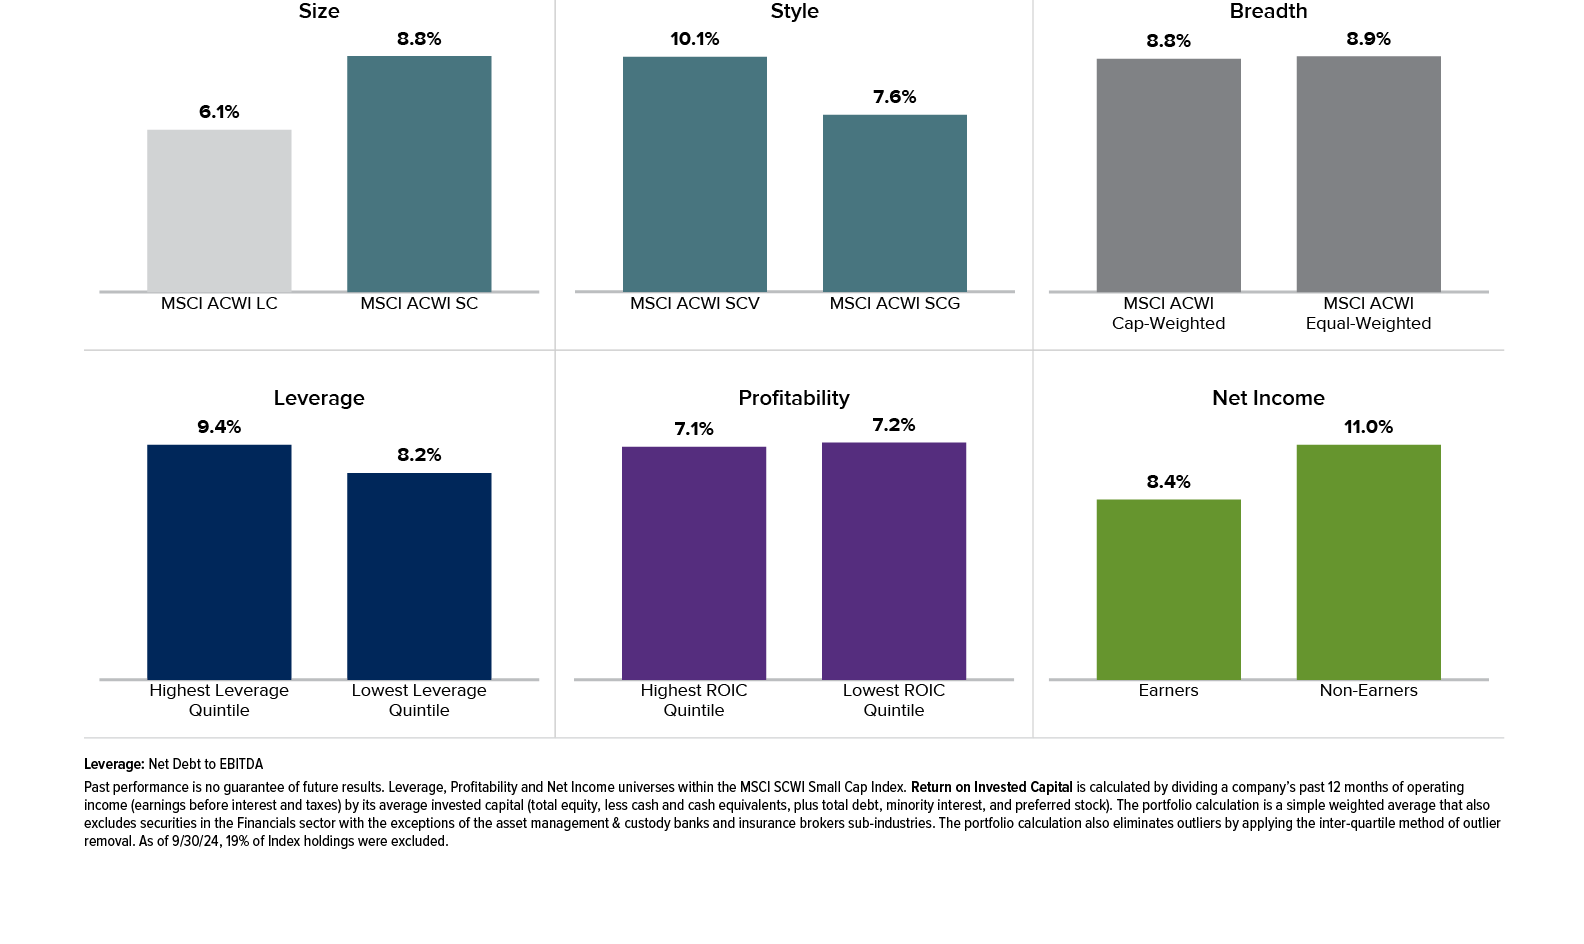
3Q24 Global Small-Cap Overview
The global small-cap market advanced in 2024’s third quarter, with small-cap value gaining more than small-cap growth. Not surprisingly, quality trailed in the quarter, as low ROIC companies advanced more than high ROIC companies, and the most levered companies outperformed the least levered, and non-earners far outpaced earners.
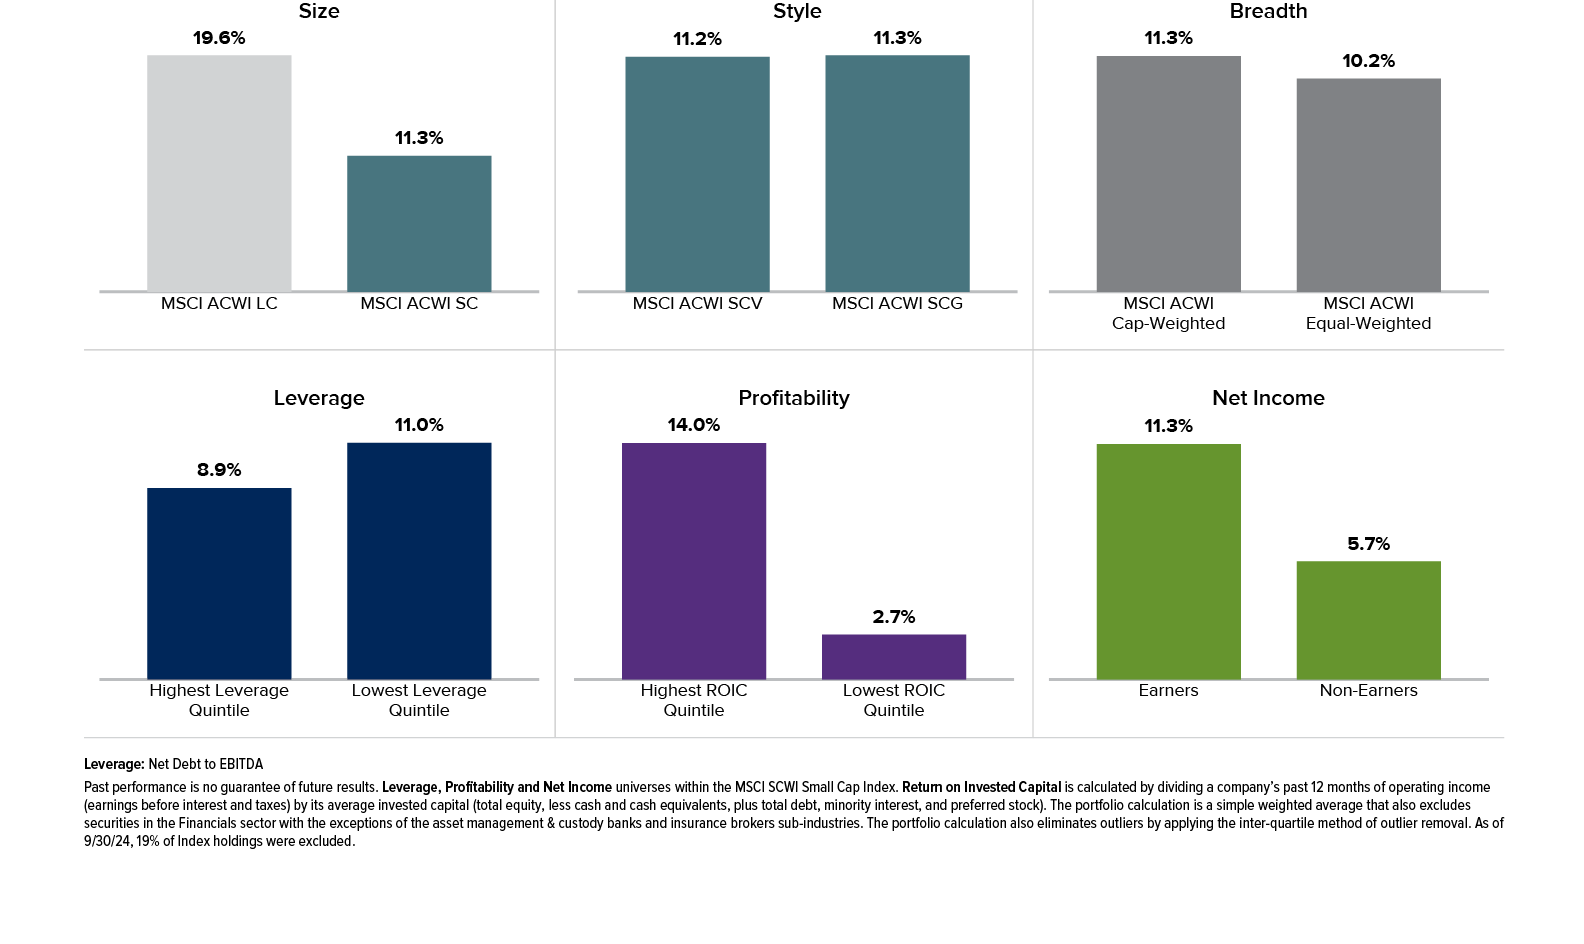
Year-to-Date Global Small-Cap Overview
The global small-cap market advanced through the first three quarters of 2024. Gains were widespread throughout the asset class. Small-cap growth slightly outperformed small-cap value, and the lowest-leverage companies outperformed those with the highest leverage for the year-to-date period. Higher ROIC companies significantly outpaced low ROIC companies, and earners handily beat non-earners.
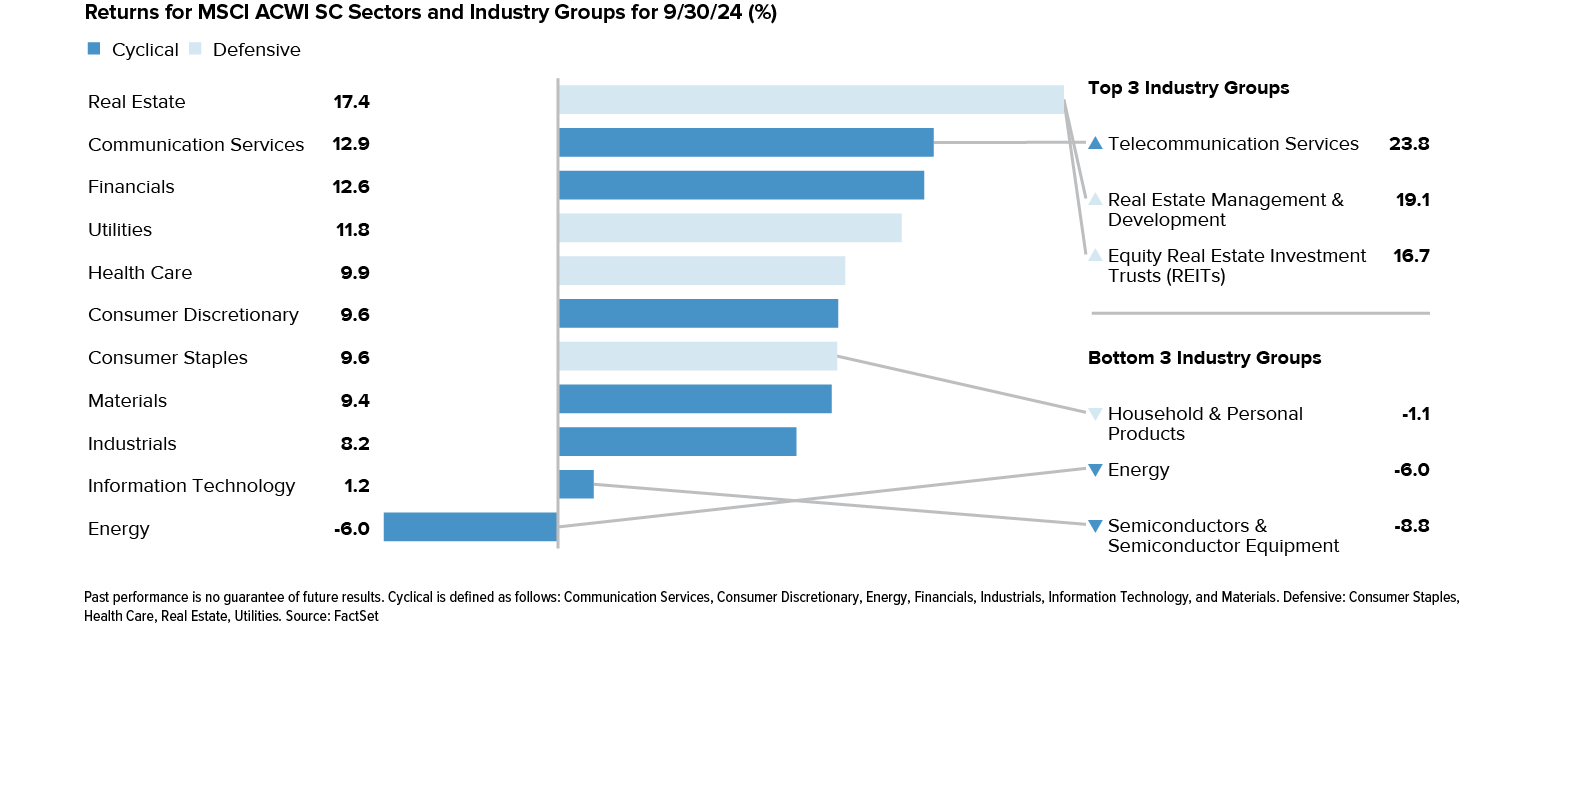
3Q24 Global Sector and Industry Review
All but one sector in the MSCI ACWI Small Cap Index contributed to third quarter performance. Real Estate led the advance followed by Communication Services and Financials. Energy was the only detractor for the quarter, while Information Technology and Industrials contributed the least.
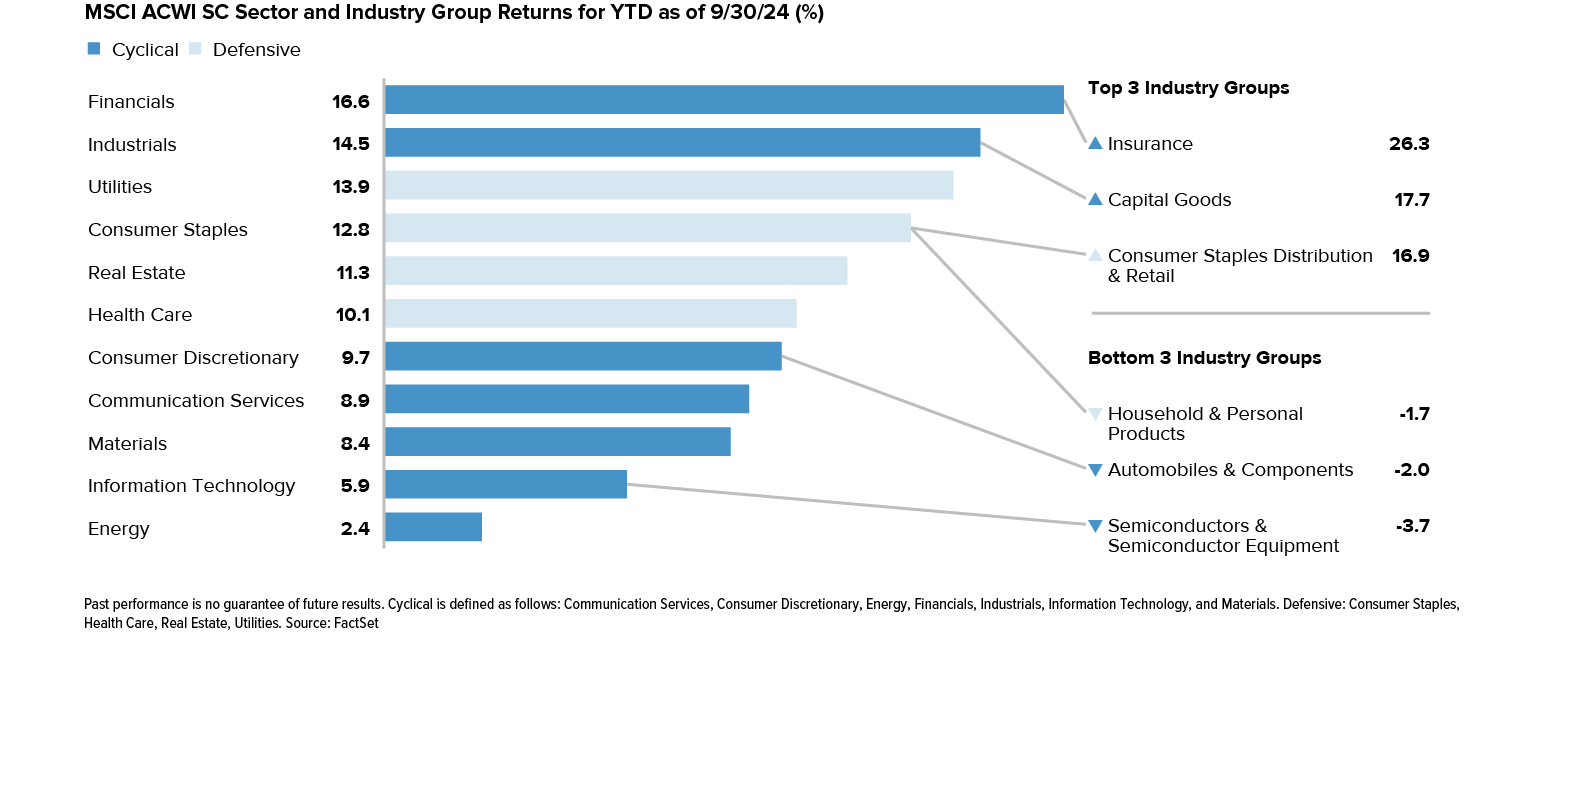
Year-to-Date Sector and Industry Review
With wide disparities in the degree of positive returns by sector, Financials advanced the most year-to-date, followed by Industrials and Utilities as investors seemed to debate the timing of the global slowdown and the direction of interest rates. Energy, Information Technology, and Materials were the smallest contributors for the year-to-date period at the end of September.
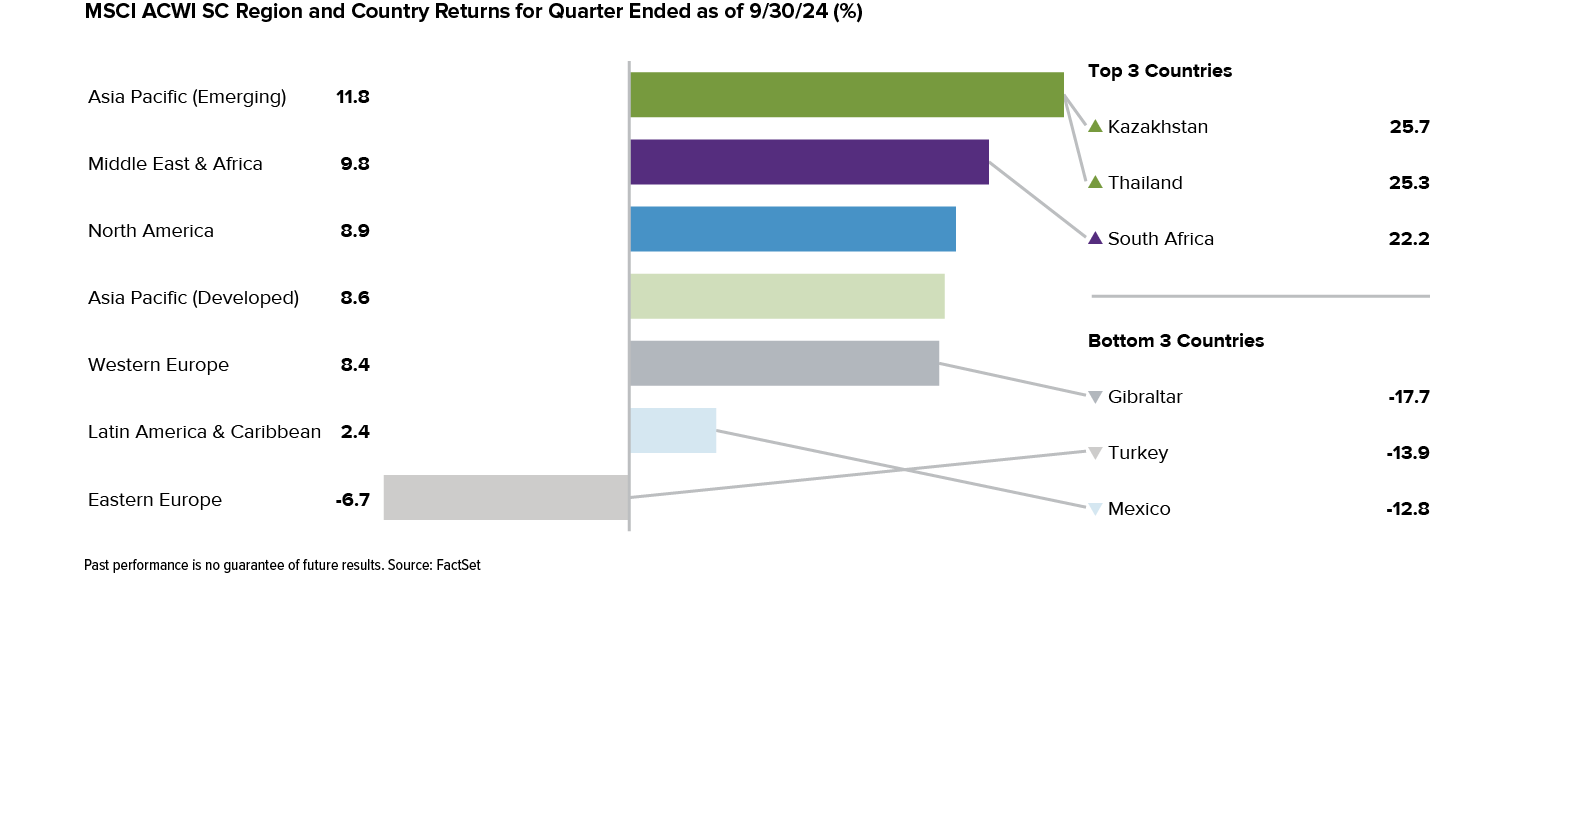
3Q24 Region and Country Review
All but one of the seven regions were positive for the third quarter. Asia Pacific (Emerging) contributed most, followed by the Middle East & Africa and North America. Eastern Europe was the only detractor in the quarter.
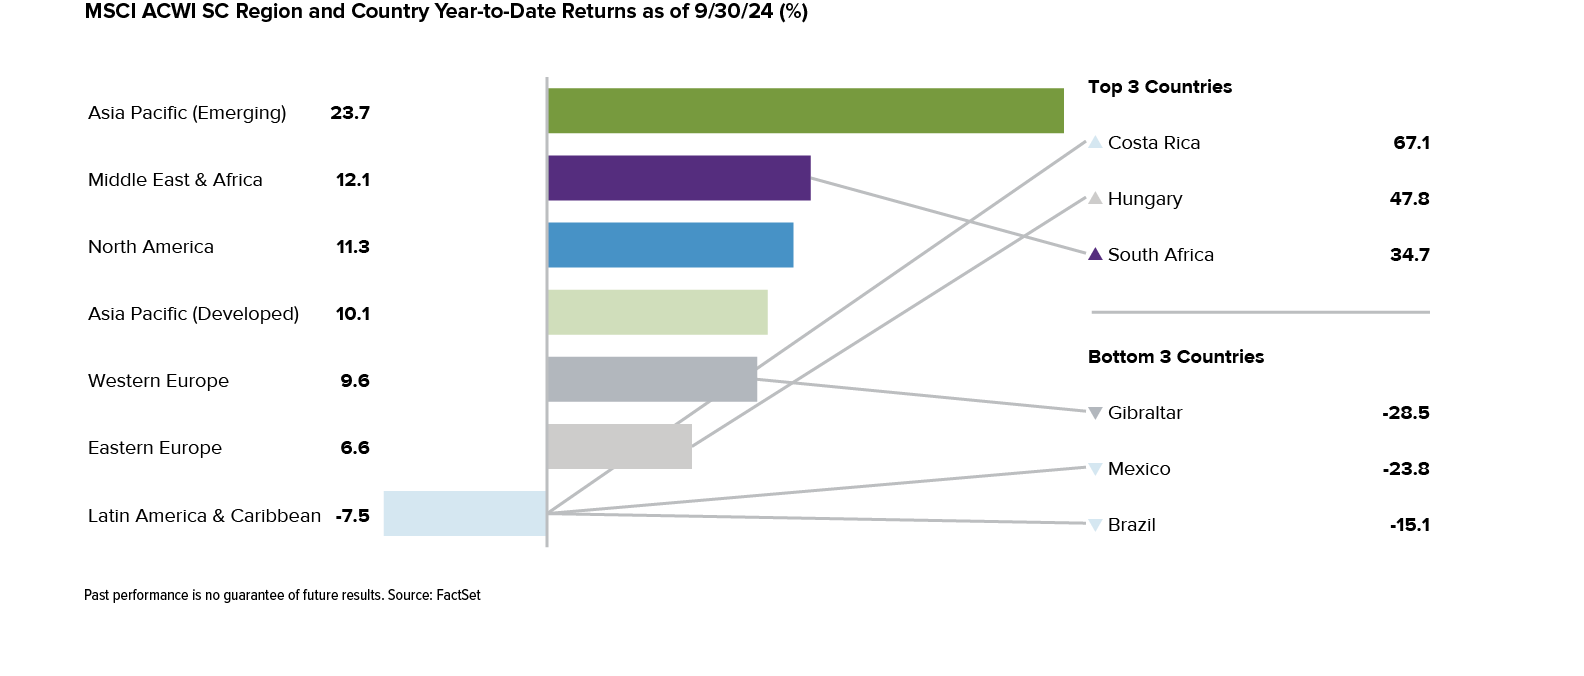
Year-to-Date Region and Country Review
Six of the seven regions were positive through the first three quarters of 2024. Asia Pacific (Emerging) led, followed by the Middle East & Africa and North America. Latin America & Caribbean was the only detractor for the year-to-date period.
Historical Perspective
The bear market in global small-caps remains firmly in place, which we think increases the probability of a robust recovery. Perhaps we have stressed the historic outperformance of global small-caps following these low return periods too strenuously of late. Yet in an uncertain world where the battle between economic growth, inflation, and a constantly looming recession has produced narrow market leadership, history and experience are even more important for understanding the potential for future returns. History shows us that these low-return periods for global small-caps have led to positive annualized 3-year returns 100% of the time—in all 71 3-year periods—averaging an impressive 15.3%, which was well above the MSCI ACWI Small Cap’s 8.0% monthly rolling average 3-year return since inception. At the same time, global small-cap continued to outperform emerging markets, a trend we expect to persist, while global high-quality stocks have endured historically extreme levels of underperformance, a trend we expect to reverse.

Global Small-Caps: More Consistent Than You Think
Global Small-Cap Has Consistently Beaten Global Large-Cap
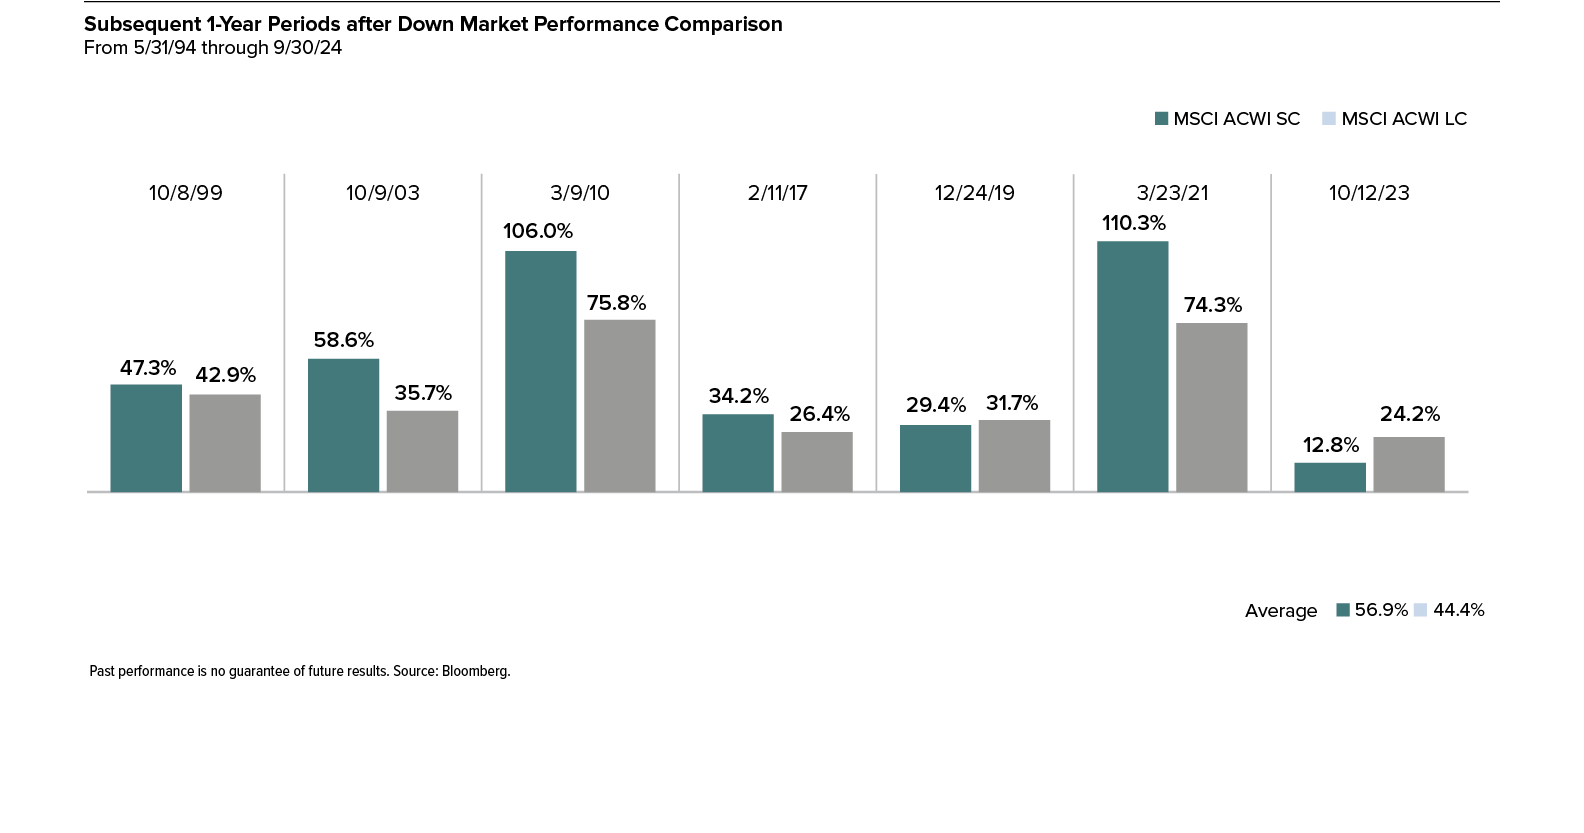
Global Small-Cap’s Most Recent Recovery is an Anomaly vs. the Historical Pattern
Small-caps typically had stronger rebounds than large-caps in five of the last six small-cap market recoveries since 1994, sometimes by sizeable margins. We anticipate a similar pattern in the next small-cap market recovery.
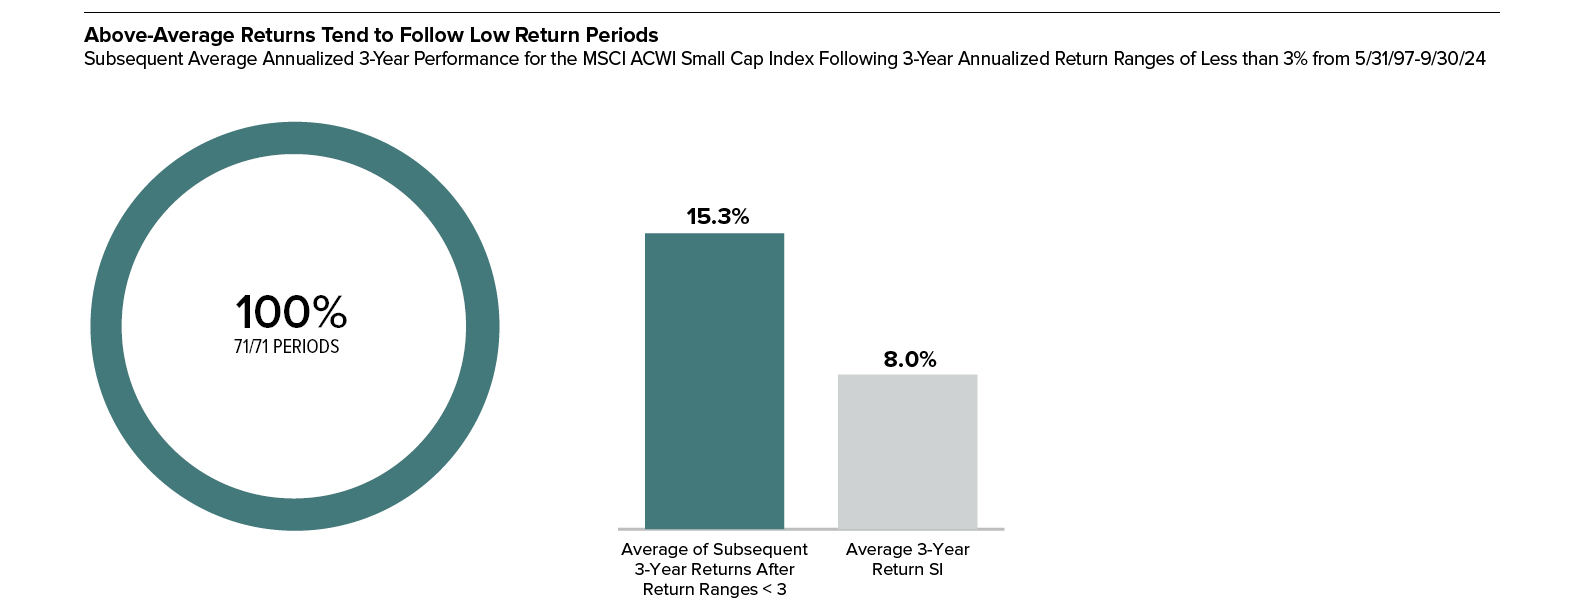
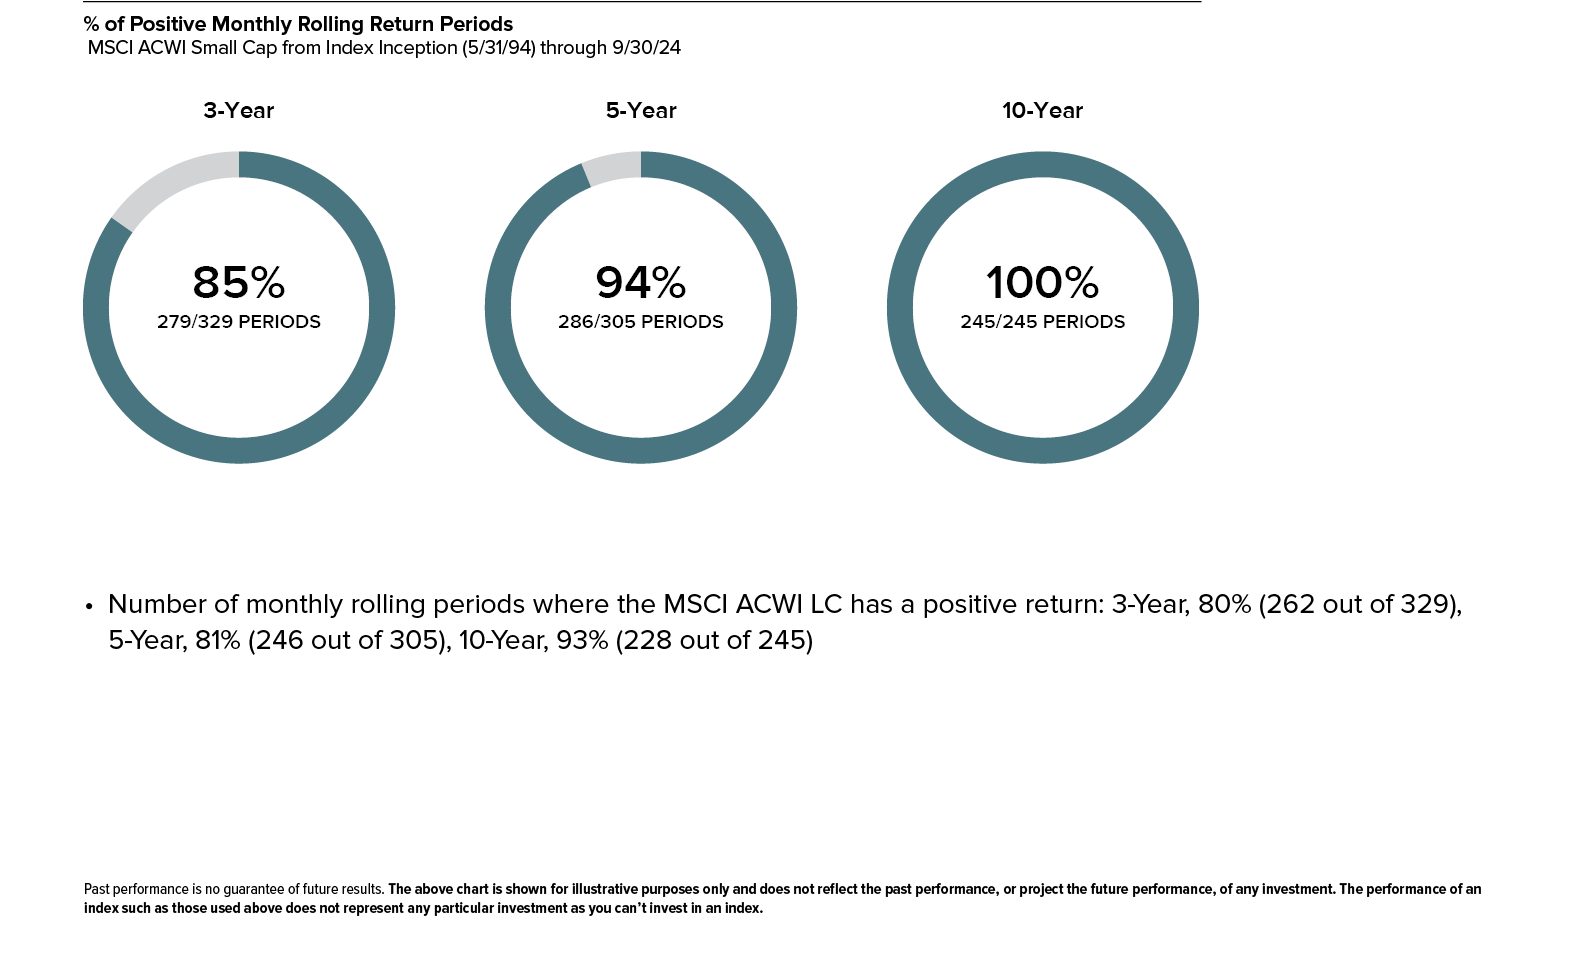
100% of the Time, Positive 3-Year Returns Have Followed Low-Return Markets
The three-year average annual total return for the MSCI ACWI Small Cap as of 9/30/24 was 2.6%. Small-cap’s historical return pattern shows that below-average return periods have been followed by those with above-average returns, with a much lower-than-average frequency of negative return periods. Specifically, the MSCI ACWI Small Cap Index had positive annualized three-year returns 100% of the time—that is, in 71 out of 71 periods—averaging an impressive 15.3% following three-year periods of less than 3% annualized returns.


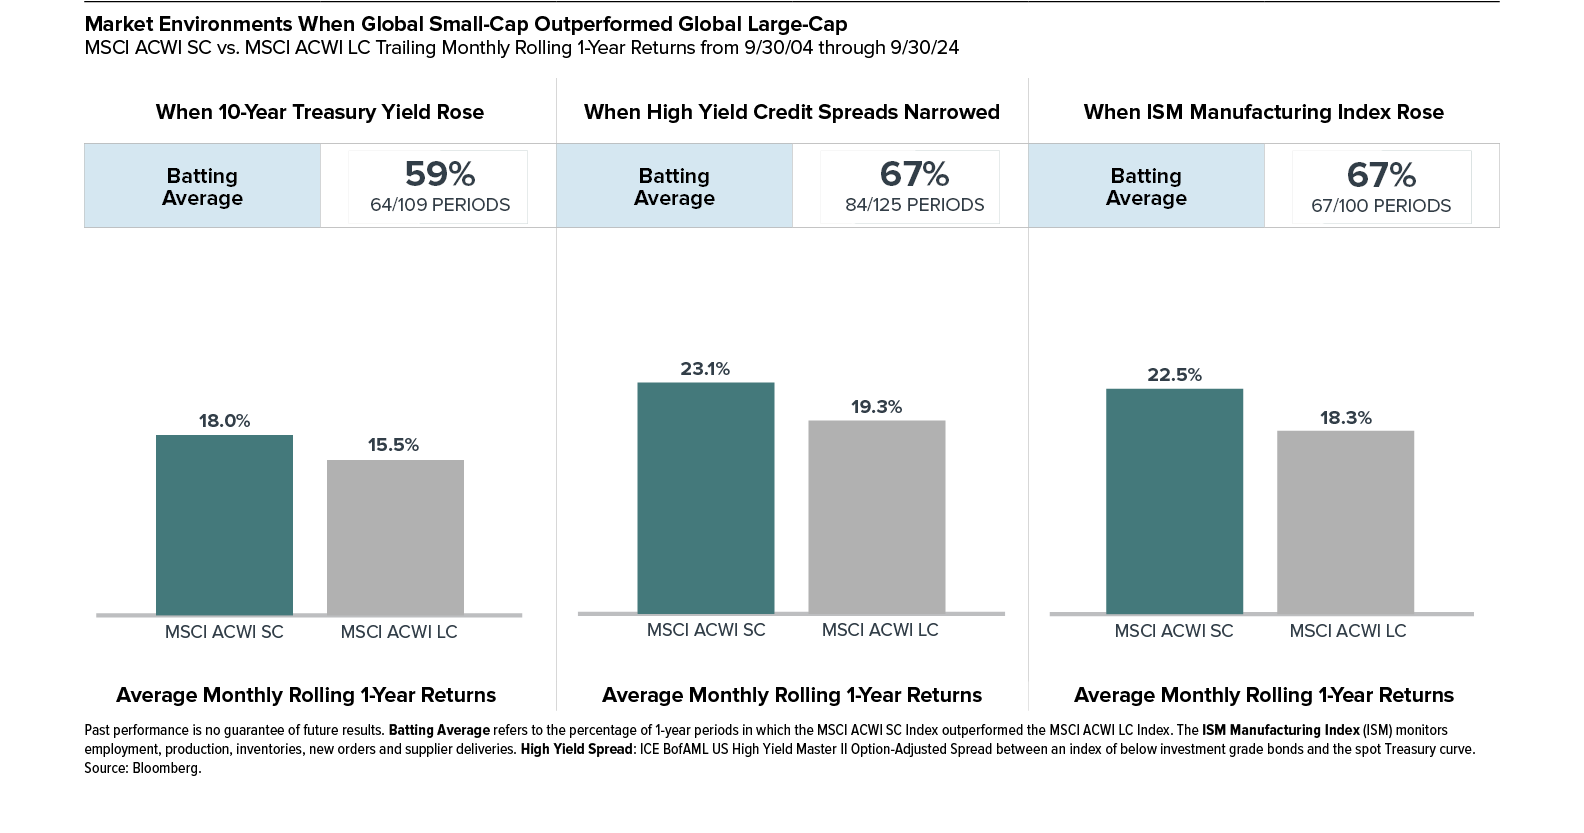
Global Small-Cap Outperformance Under Different Regimes
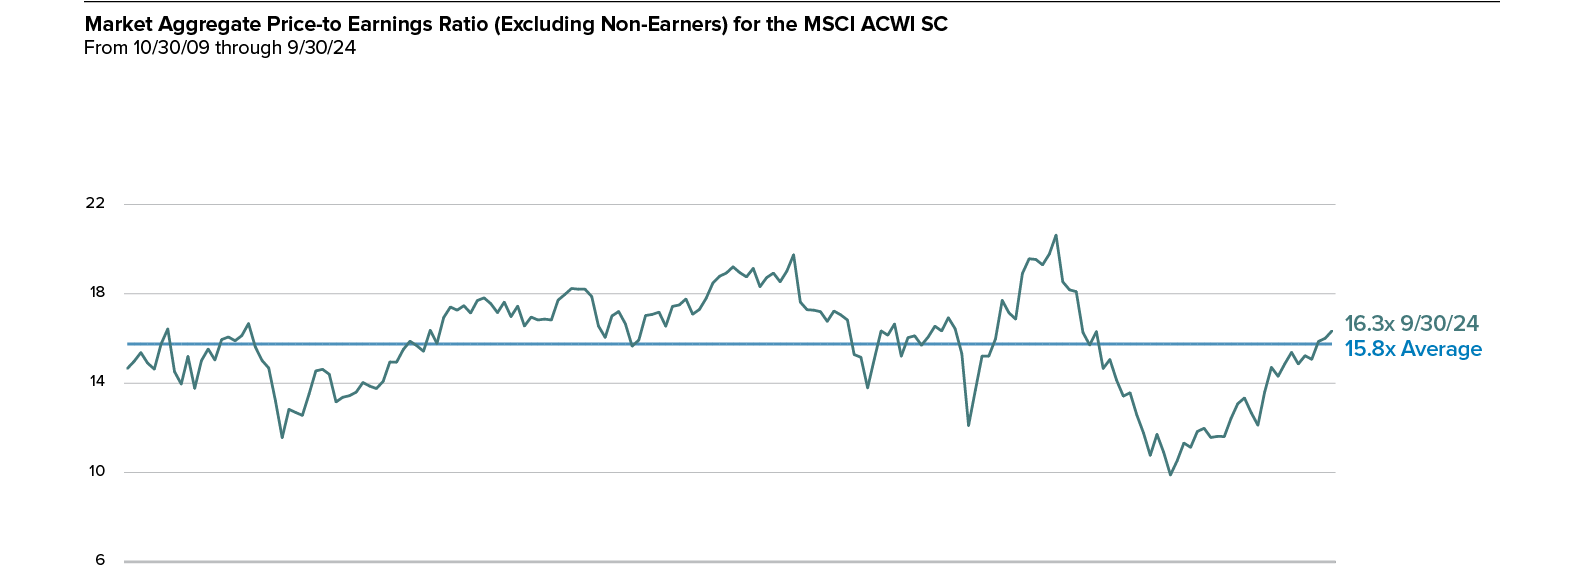
Global Small-Cap P/Es are Slightly Above Their Historical Average
The average price to earnings ratio for the MSCI ACWI Small-Cap Index has returned to a level close to its historical average of 15.8x.
Global Small-Cap Market Outlook
The indicators that we monitor suggest three high-conviction expectations based on past performance patterns: Global small-caps seem likely to post positive returns over the next three years while also looking likely to best global large-caps over the same period as the current high fear moment continues to recede. At the same time, we expect global small-caps to continue outperforming emerging markets and high quality to outperform. Experience tells us that now is the time for small-caps and, importantly, active management.

Despite Leading in 3Q24, Global Small-Cap Is Trailing Large-Cap YTD
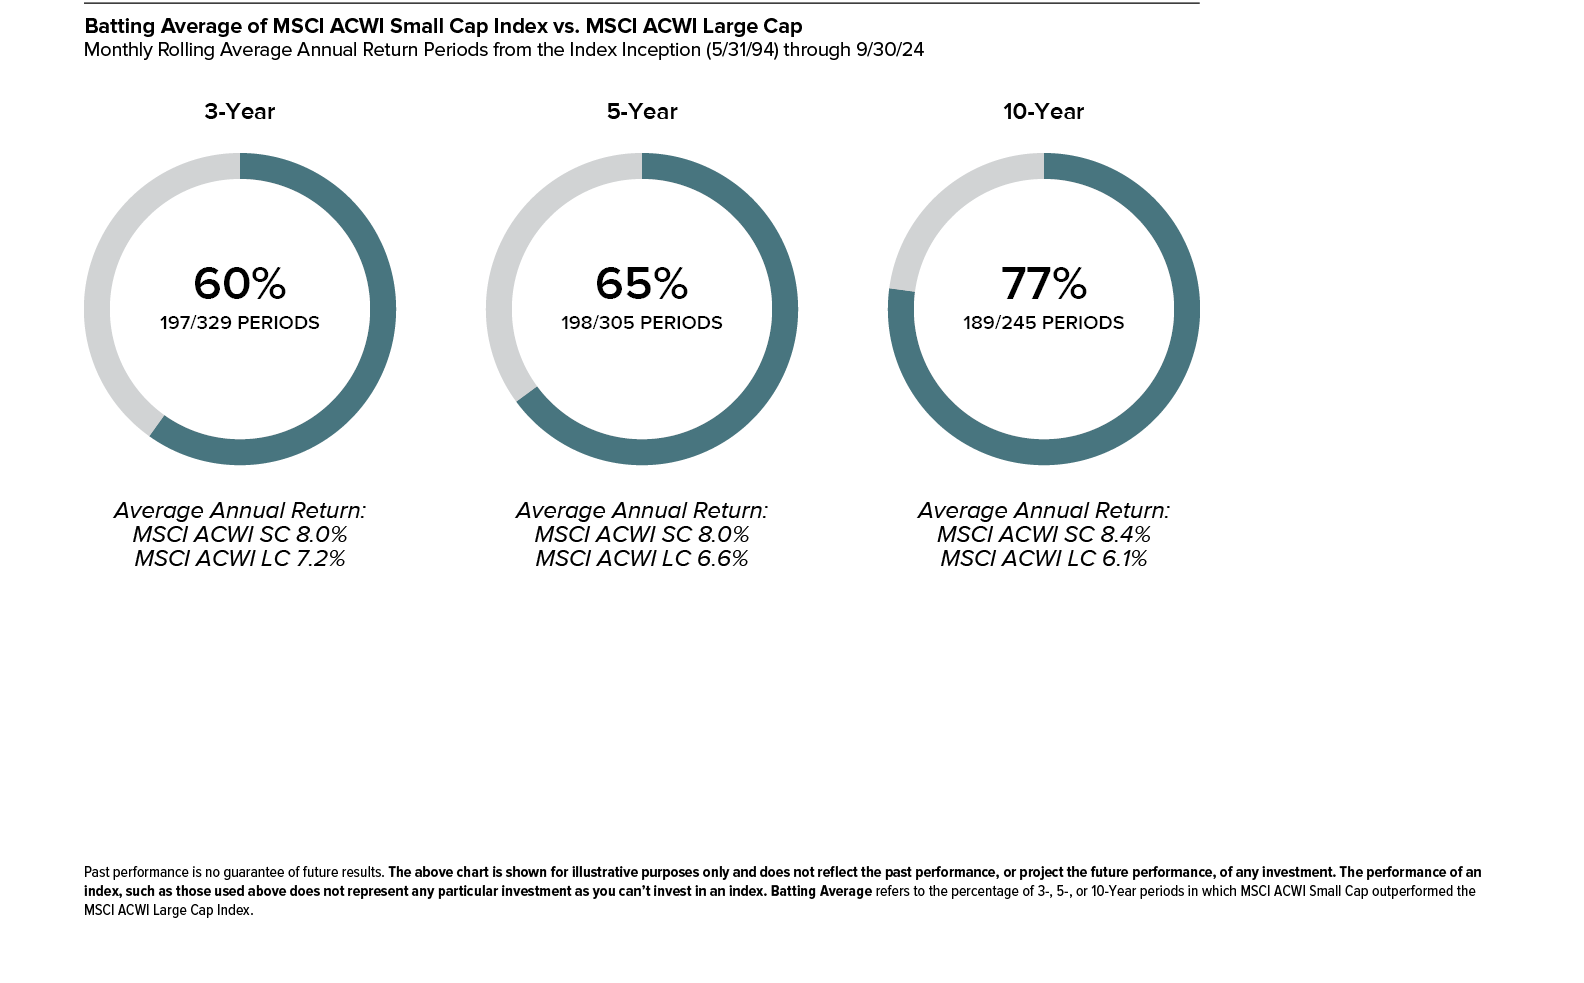
When equity markets are declining, small-caps typically underperform large-caps. However, it’s worth recalling that global small-caps have bested global large-caps in 60% of rolling 3-year periods. Given both this history and global small-caps’ pattern of outperformance in market recoveries, we see subsequent outperformance of their larger siblings as likely.

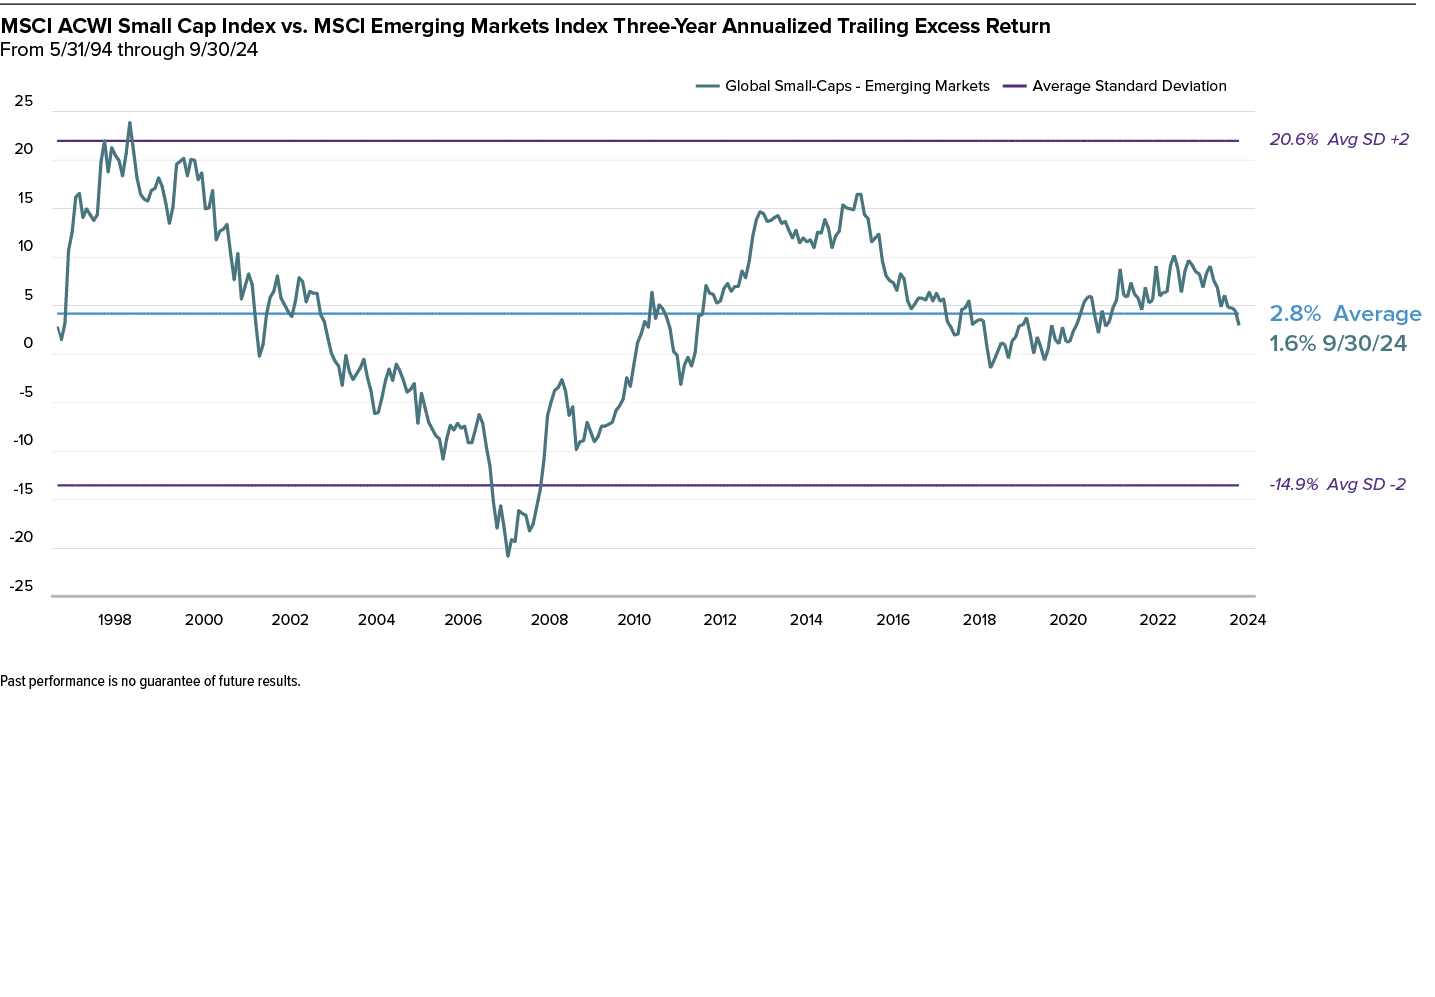
Global Small-Caps Continue to Lead Emerging Markets
Though some investors may consider emerging market equities to be a substitute for global small-caps, we highlight that the two asset classes have very different historical performance profiles. Through the latest quarter end, global small-caps continued the outperformance trend that has largely been in place for most of the past 10 years.
Market Overview
Global small-caps advanced in the third quarter of 2024 as the expectation of easier monetary policy became a reality. Yet even with a strong quarterly showing, stocks and bonds from many geographies wrestled with a challenging combination of stubborn inflation, rising interest rates, and stalled economic growth that has led to earnings declines. And while recession remains a reality or possibility (depending on geography), none of us knows how long it will last or how deep it will go. What we do know is that any recession—like any bear market—is ultimately finite. Any recession will be followed by a recovery. It’s worth keeping in mind that history also shows that small-caps will likely begin an upward move before many of us know for sure that the economy is rebounding in earnest. Amid the difficulties of bear markets and periods of economic uncertainty, we think it’s crucial to remind investors of the opportunity to build their small-cap allocation at attractively low prices. History shows the rewards that have accrued to investors who had the necessary patience and discipline to stay invested during periods of sluggish or negative performance. We continue to see the currently unsettled period as an opportune time to invest in select small-caps for the long run.
Historical Perspective
The bear market in global small-caps remains firmly in place, which we think increases the probability of a robust recovery. Perhaps we have stressed the historic outperformance of global small-caps following these low return periods too strenuously of late. Yet in an uncertain world where the battle between economic growth, inflation, and a constantly looming recession has produced narrow market leadership, history and experience are even more important for understanding the potential for future returns. History shows us that these low-return periods for global small-caps have led to positive annualized 3-year returns 100% of the time—in all 71 3-year periods—averaging an impressive 15.3%, which was well above the MSCI ACWI Small Cap’s 8.0% monthly rolling average 3-year return since inception. At the same time, global small-cap continued to outperform emerging markets, a trend we expect to persist, while global high-quality stocks have endured historically extreme levels of underperformance, a trend we expect to reverse.
Market Outlook
The indicators that we monitor suggest three high-conviction expectations based on past performance patterns: Global small-caps seem likely to post positive returns over the next three years while also looking likely to best global large-caps over the same period as the current high fear moment continues to recede. At the same time, we expect global small-caps to continue outperforming emerging markets and high quality to outperform. Experience tells us that now is the time for small-caps and, importantly, active management.
Key Takeaways for 3Q24
745 Fifth Avenue | New York, NY 10151 | P (800) 348-1414 | www.royceinvest.com
Client Services Group | P (800) 33-ROYCE (800-337-6923)

The performance data and trends outlined in this presentation are presented for illustrative purposes only. All performance information is presented on a total return basis and reflects the reinvestment of distributions. Past performance is no guarantee of future results. Historical market trends are not necessarily indicative of future market movements. Source: MSCI. MSCI makes no express or implied warranties or representations and shall have no liability whatsoever with respect to any MSCI data contained herein. The MSCI data may not be further redistributed or used as a basis for other indexes or any securities or financial products. This report is not approved, endorsed, reviewed or produced by MSCI. None of the MSCI data is intended to constitute investment advice or a recommendation to make (or refrain from making) any kind of investment decision and may not be relied on as such. The MSCI ACWI Small Cap Index is an unmanaged, capitalization-weighted index of global small-cap stocks. The MSCI ACWI Large Cap Index is an unmanaged, capitalization-weighted index of global large-cap stocks. The MSCI ACWI ex USA Small Cap Index is an unmanaged, capitalization-weighted index of global small-cap stocks, excluding the United States. The MSCI ACWI ex USA Large Cap Index is an unmanaged, capitalization-weighted index of global large-cap stocks, excluding the United States. The MSCI Emerging Markets Index is an unmanaged, capitalization-weighted index of stocks in emerging markets countries. Index returns include net reinvested dividends and/or interest income. The performance of an index does not represent exactly any particular investment, as you cannot invest directly in an index. Royce & Associates, LP, the investment advisor of The Royce Fund and Royce Capital Fund, is a limited partnership organized under the laws of Delaware. Royce & Associates, LP primarily conducts its business under the name Royce Investment Partners.
Sector and industry weightings are determined using the Global Industry Classification Standard (“GICS”). GICS was developed by, and is the exclusive property of, Standard & Poor’s Financial Services LLC (“S&P”) and MSCI Inc. (“MSCI”). GICS is the trademark of S&P and MSCI. “Global Industry Classification Standard (GICS)” and “GICS Direct” are service marks of S&P and MSCI.

Notes, Performance and Risk Disclosure